Getting You Through Your Research Methods Module
Jan 20, 2025
•
2 min read
P-Value And Statistical Significance: What It Is & Why It Matters
When you perform a statistical test, a p-value helps you determine the significance of your results in relation to the null hypothesis.
https://www.simplypsychology.org/p-value.html
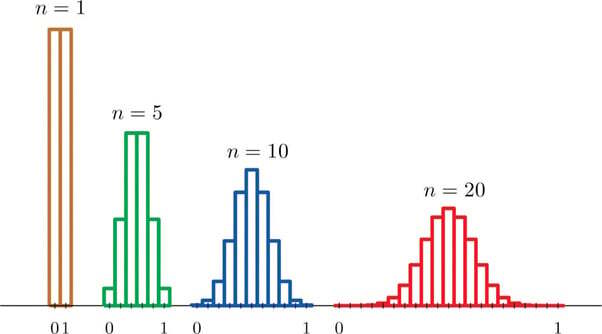
Understanding Sampling Distribution In Statistics
In statistics, a sampling distribution shows how a sample statistic, like the mean, varies across many random samples from a population. It helps make predictions about the whole population.
https://www.simplypsychology.org/sampling-distribution.html
Confidence Intervals Explained: Examples, Formula & Interpretation
The confidence interval (CI) is a range of values that’s likely to include a population value with a certain degree of confidence. It is often expressed as a % whereby a population mean lies between an upper and lower interval.
https://www.simplypsychology.org/confidence-interval.html
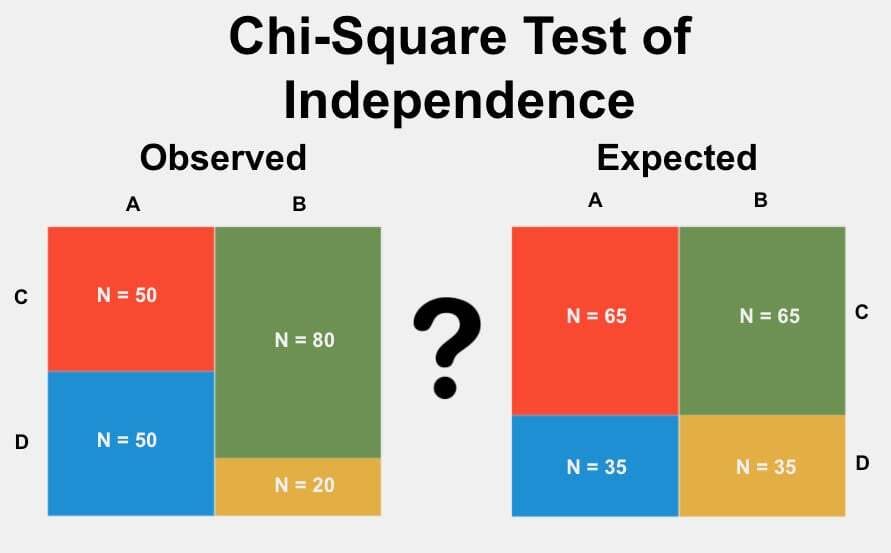
Chi-Square (Χ²) Test & How To Calculate Formula Equation
The Chi-square test (pronounced Kai) looks at the pattern of observations and will tell us if certain combinations of the categories occur more frequently than we would expect by chance, given the total number of times each category occurred.
https://www.simplypsychology.org/chi-square.html
Box Plot Explained: Interpretation, Examples, & Comparison
Box plots visually show the distribution of numerical data and skewness by displaying the data quartiles (or percentiles) and averages.
https://www.simplypsychology.org/boxplots.html
simplypsychologyofficialView more on InstagramsimplypsychologyofficialAdd a comment...
simplypsychologyofficial
View more on Instagram
Login or Subscribe to participate